TL;DR
Gemini 3.6 Flash led the August 2026 test of 22 stock questions with a blended score of 0.841 and 86.4% success. Luna scored 0.550 overall but 0.931 among its thirteen graded answers; nine ungraded cells lowered its blended result. The ranking therefore measures answer delivery as well as correctness. The published P/E example still needs a fiscal-period correction and has not been rerun. This SQL evaluation measures financial-data answers, not investment returns.
- Published
- 2026-08-08
- Published model rows
- 6
- Evidence
- Historical task evaluation
Which model answered the stock questions?
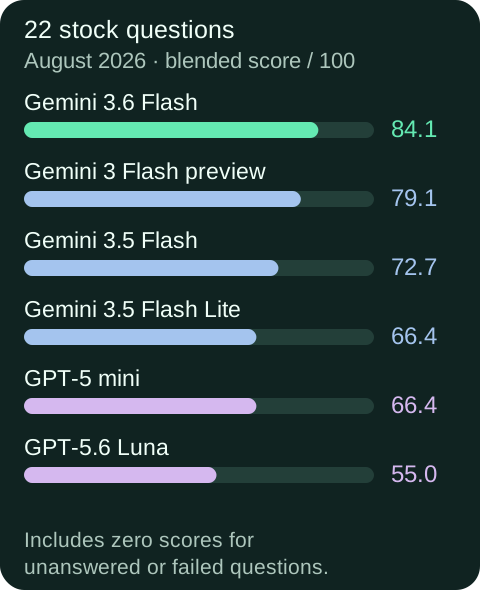
Gemini 3.6 Flash led this historical 22-question screening test. The score rewards correct answers and penalizes questions that never get an answer. Follow the example below to see what the models had to do.
P/E means price-to-earnings. In this example, the answer must identify a historical price and the earnings period behind the ratio, rather than list current ticker opinions.
Follow one published stock question
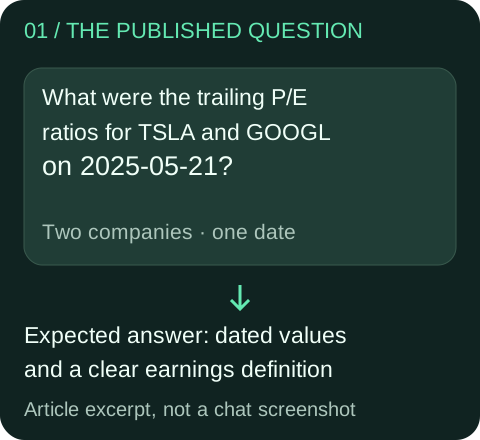
Ask for two historical P/E ratios
What were the trailing P/E ratios for TSLA and GOOGL on 2025-05-21?
See the original question and queryThe answer needs both tickers, the requested date, a price and a clearly defined earnings denominator. This is the article’s worked example; the article does not identify it as one of the 22 scored fixtures.
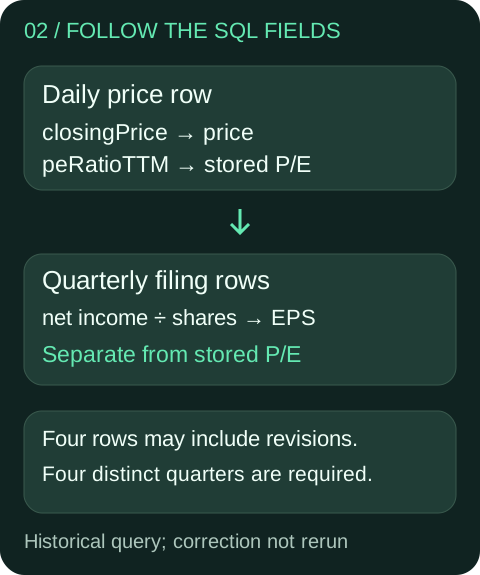
Inspect the SQL’s answer fields
The published query selects the latest price date at or before May 21 and joins an EPS aggregate. This exact excerpt is its output projection; it needs the article’s preceding CTEs and joins.
pe_ratio comes from p.peRatioTTM. It is not price divided by the displayed ttm_eps. The original EPS CTE selected four filing rows without first deduplicating fiscal periods, so restatements can break a four-quarter denominator.
SELECT p.ticker, p.date::DATE AS date,
       CAST(p.closingPrice AS DOUBLE) AS price,
       CAST(t.ttm_eps AS DOUBLE) AS ttm_eps,
       CAST(p.peRatioTTM AS DOUBLE) AS pe_ratio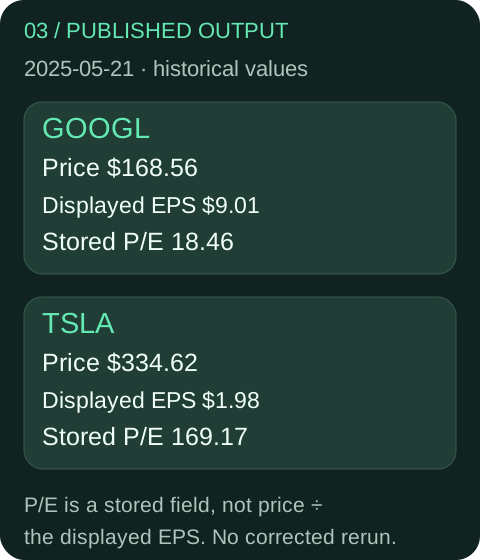
Read the published output
GOOGL: $168.56 price, $9.01 displayed TTM EPS, 18.46 stored P/E. TSLA: $334.62 price, $1.98 displayed TTM EPS, 169.17 stored P/E. Both rows show 2025-05-21.
These are the article’s historical reported values. The query has not been rerun with the fiscal-period correction. A fresh answer may differ; do not treat these rows as certified point-in-time recomputations.
Check what earns a score
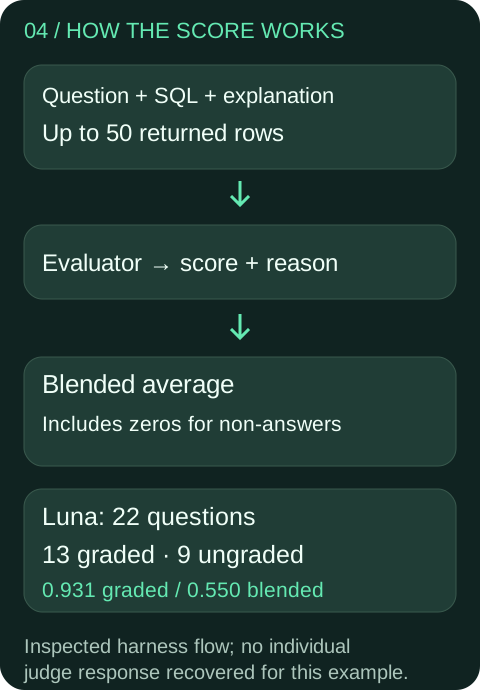
The evaluator reads the question, SQL, explanation and up to 50 returned rows. A clarification or execution failure contributes zero to the blended average. Luna’s nine ungraded cells explain why its 0.550 blended score differs from its 0.931 mean across thirteen graded cells.
For this example, a review should check dates, both tickers, distinct fiscal quarters and the meaning of the P/E column. This is a review checklist, not a recovered judge response. No individual grade or model attribution is published for this example.
Choose using the measurement you need
Historical answer delivery
Gemini 3.6 Flash led the published blended score and success rate. That supports its selection for this tested screening workload.
Correctness after SQL runs
A blended score penalizes non-answers. Luna’s 0.931 graded-only mean shows why its 0.550 should not be read as a pure SQL-quality score. Comparable graded-only means for every arm are needed to rank that metric.
Waiting time and cost
The table reports average workflow seconds, not production p50 latency. It has no per-model cost column; it cannot establish the cheapest model.
All six published rows
Original units preserved. Average score is the historical blended measure; this table is not a new run.
Open the original scores and timing
Scroll sideways to compare all columns. Select a heading to sort.
| google/gemini-3.6-flash | 0.841 | 1.00 | 86.4% | 26.6s |
| google/gemini-3-flash-preview | 0.791 | 1.00 | 81.8% | 18.9s |
| google/gemini-3.5-flash | 0.727 | 1.00 | 72.7% | 33.3s |
| google/gemini-3.5-flash-lite | 0.664 | 0.90 | 72.7% | 19.4s |
| openai/gpt-5-mini | 0.664 | 1.00 | 68.2% | 41.5s |
| openai/gpt-5.6-luna | 0.550 | 0.75 | 59.1% | 27.0s |
No matching rows. Clear the filter to see all records.
Original units preserved. Average score is the historical blended measure; this table is not a new run.
Source and study limits
Read the methodology and provenance
Each question was converted into DuckDB SQL, executed against the real financial lake and graded for answer correctness. This measures executable data retrieval, not free-form ticker opinions.
The source publishes average score, median score, success rate and average execution time. Average execution time is not a production p50 latency measure.
These are the August study’s exact versions, data and questions. They do not establish the best model for every stock-research task or current production defaults.
A successful SQL query is not a profitable investment strategy. No return or trading signal performance is measured in this table.
Answer scores depend on the question corpus and grading process. Changing schemas, tools or prompts can change the ranking.
The current owning harness separates blended score, graded-only SQL quality and completion. Its current grader defaults do not establish which judge graded the historical August publication. The article’s P/E example is an illustration, with no published individual grading receipt.
No comments yet.