TL;DR
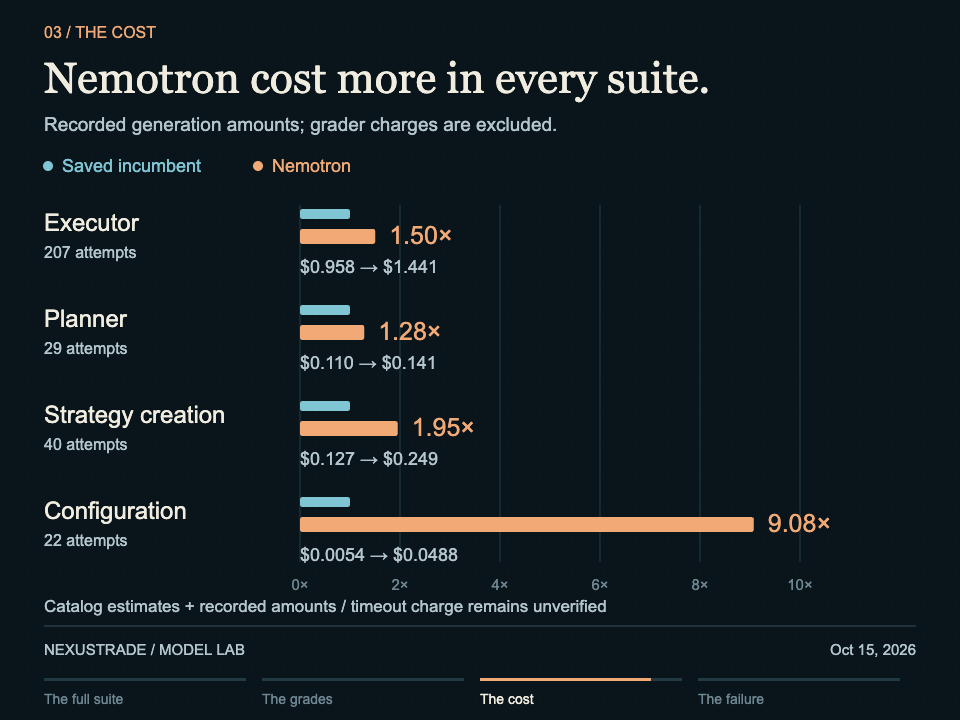
Nemotron 3.5 Super VL scored below the saved results for our selected models across four full NexusTrade benchmark suites on October 15, 2026. The 298 attempts covered execution, planning, strategy creation and backtest configuration. Accounted generation cost was 1.3 to 9.1 times as high.
The baselines were recorded between September 22 and October 8. Prompts, context and strategy-repair behavior changed between runs, so these gaps describe a historical comparison.
Watch all four jobs move through the experiment
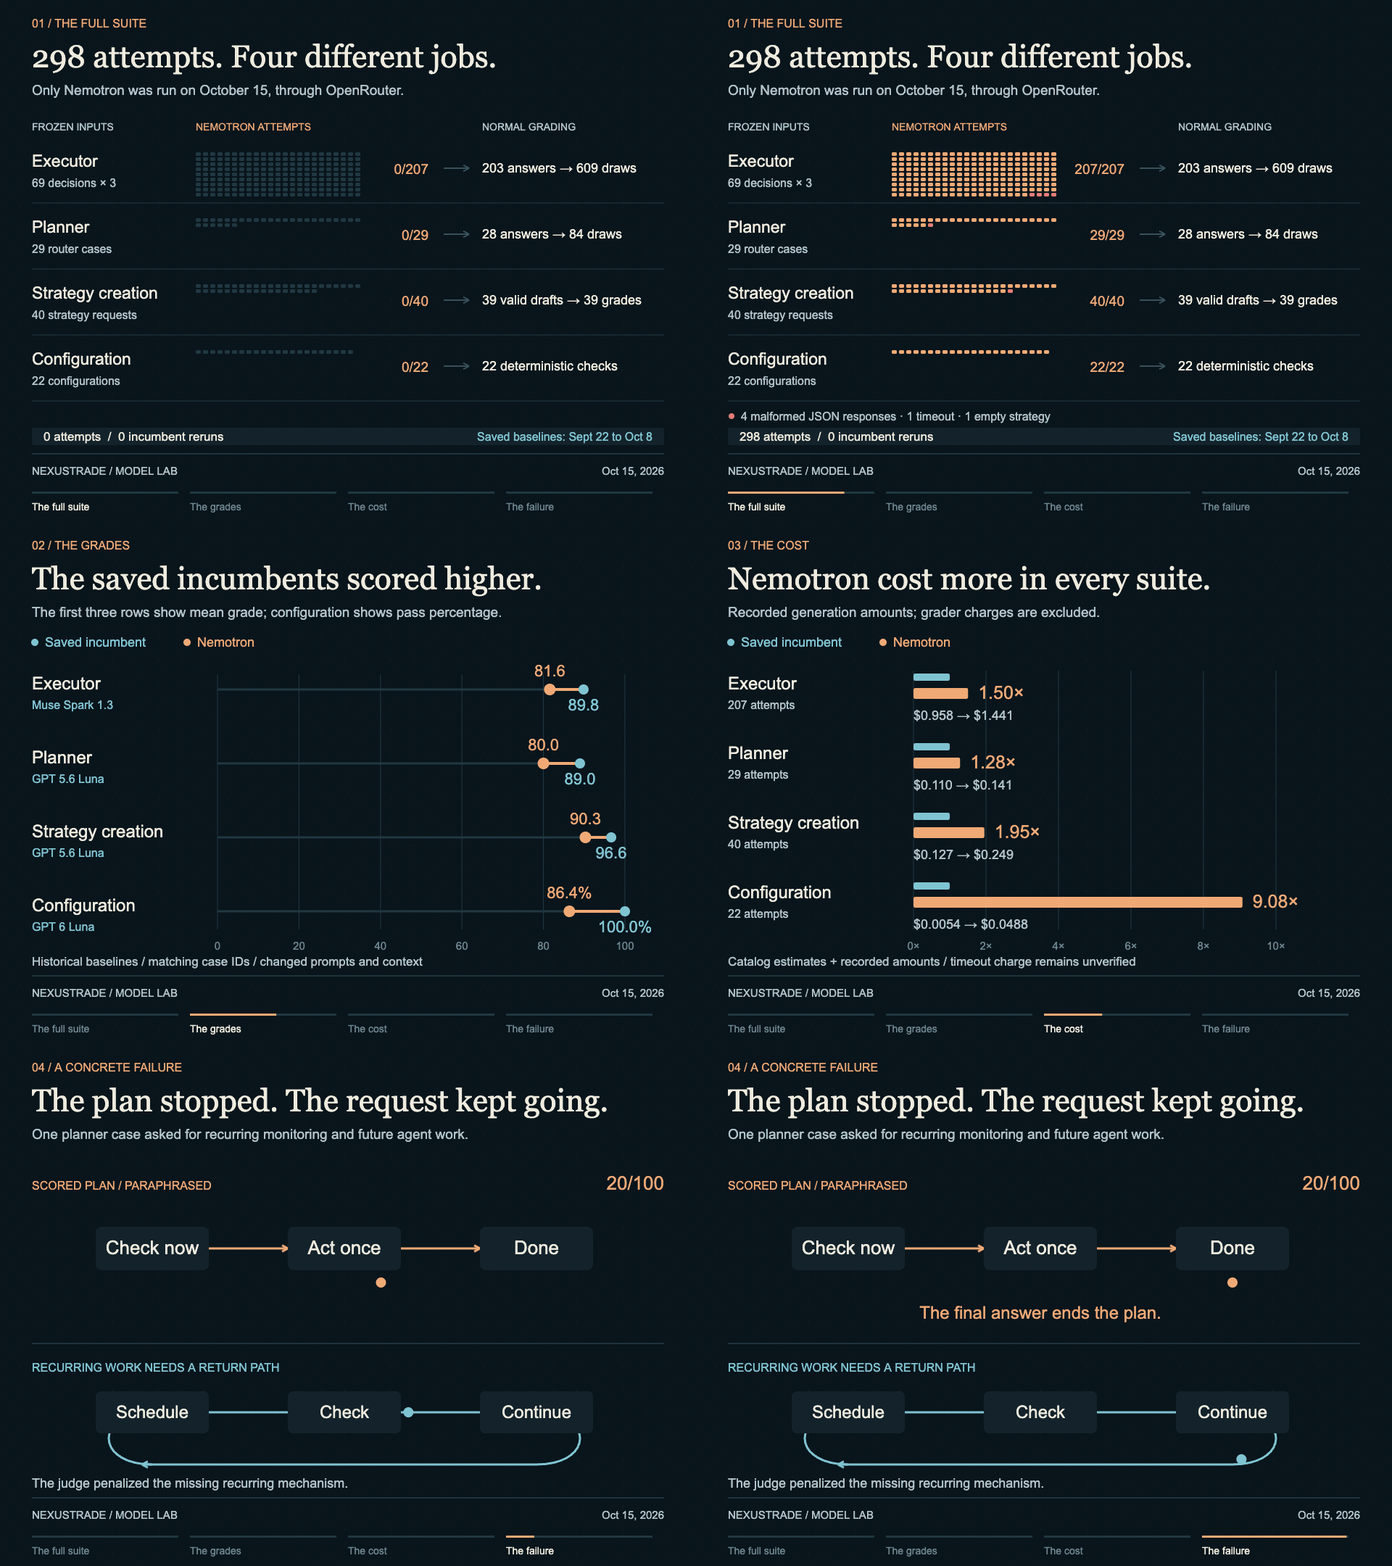
Each job asks the model to produce something different. The executor chooses the next tool action from a frozen conversation. The planner turns a request into a sequence of work. Strategy creation produces executable portfolio rules. Backtest configuration specifies the dates, portfolio and other inputs for a test.
The full run preserved every failed attempt. Four executor responses failed JSON parsing. One planner call hit the ten-minute deadline. Another strategy response contained no usable code.
The score gaps appeared in all four jobs
The same case identities appear in the saved and new runs. Matching identities preserves the workload; newer prompts, context and repair behavior still affect the comparison.
Show the table · 4 rows, 5 columns
Scroll sideways to compare all columns. Select a heading to sort.
| Executor | Muse Spark 1.3 Contributor | 89.8/100 | 81.6/100 | 207 attempts/cases |
| Planner | GPT 5.6 Luna | 89.0/100 | 80.0/100 | 29 attempts/cases |
| Strategy creation | GPT 5.6 Luna | 96.6/100 | 90.3/100 | 40 attempts/cases |
| Backtest configuration | GPT 6 Luna | 22/22 passed | 19/22 passed | 22 attempts/cases |
No matching rows. Clear the filter to see all records.
The first three results are mean grades. Configuration reports fully correct cases. Failed candidate attempts remain in the denominator.
Muse Spark’s saved executor result was 89.8 out of 100, compared with Nemotron’s 81.6. At the benchmark’s 75-point correctness threshold, Muse passed 185 of 207 attempts and Nemotron passed 154. Nemotron’s mean grade was 81.6, while its attempt pass rate was 74.4%.
The saved GPT 5.6 Luna planner averaged 89.0, versus Nemotron’s 80.0. Strategy creation averaged 96.6 for Luna and 90.3 for Nemotron. Backtest configuration used deterministic checks: GPT 6 Luna passed 22 of 22 cases, while Nemotron passed 19.
A one-time plan left an ongoing request unfinished
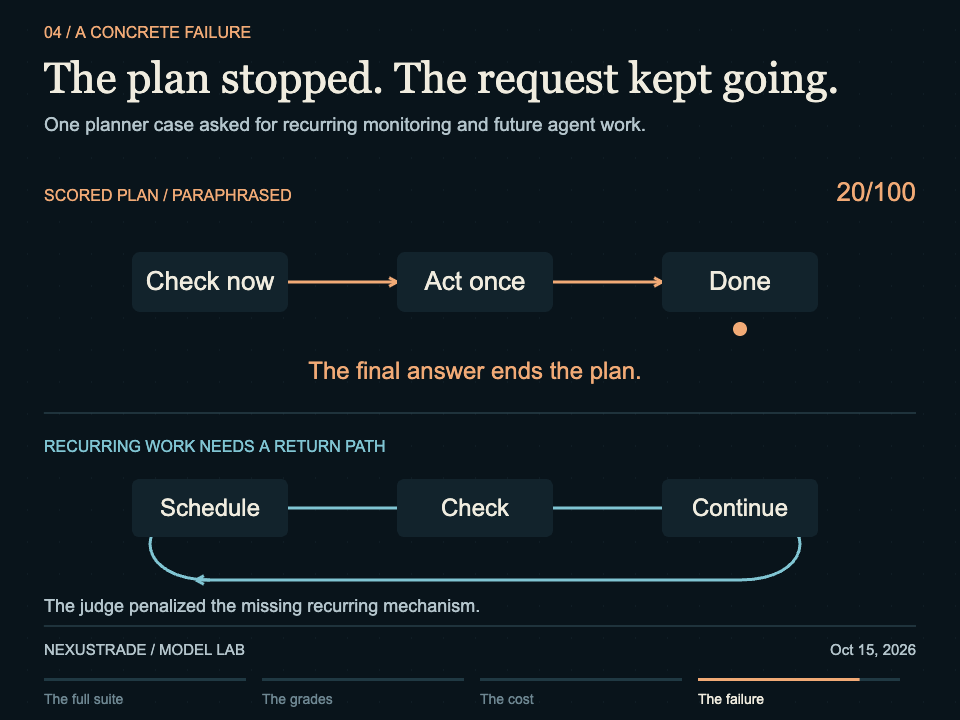
One request called for recurring monitoring and future agent work. Nemotron’s plan fetched the paper portfolio, requested prices, evaluated conditions, staged a conditional order and ended with a final answer. It provided no recurring mechanism to launch the later work.
The missing return path matters after the first check. A plan that completes one evaluation cannot observe a condition that changes tomorrow. The normal planner judge scored this response 20 out of 100.
Three configurations failed: one answer emitted a configuration when it should have refused a request without a portfolio. Two others corrupted the supplied portfolio identifiers.
The lower grades came with higher generation cost
Show the table · 4 rows, 5 columns
Scroll sideways to compare all columns. Select a heading to sort.
| Executor | $0.958020 | $1.441242 | 1.50× | 207 |
| Planner | $0.110080 | $0.141325 | 1.28× | 29 |
| Strategy creation | $0.127416 | $0.248959 | 1.95× | 40 |
| Backtest configuration | $0.005376 | $0.048785 | 9.08× | 22 |
No matching rows. Clear the filter to see all records.
Generation only. The separate $2.88 accounted campaign total includes grading. The missing planner-timeout charge is not assumed to be zero.
The executor suite cost about $0.96 for Muse and $1.44 for Nemotron. The Nemotron total includes $0.259 recovered from the provider records for its four malformed responses. Leaving failed outputs out would understate the cost of the run.
Planning rose from $0.110 to $0.141 across 29 cases. Strategy generation rose from $0.127 to $0.249 across 40. Configuration rose from $0.0054 to $0.0488 across 22, roughly nine times the incumbent’s recorded amount.
These totals combine recorded provider-response amounts and catalog calculations. They are accounted benchmark amounts rather than verified invoices. Input lengths, caching and routing changed between the historical and new runs.
Planning took more than twice as long
Complete saved and new suites are shown for these three jobs. The timers cover the generation request and include failed attempts. Strategy-generation timing is discussed separately.
Show the table · 4 rows, 4 columns
Scroll sideways to compare all columns. Select a heading to sort.
| Executor | 14.11s | 15.74s | 207 attempts per model |
| Planner | 15.17s | 33.42s | 29 attempts per model |
| Strategy creation | 8.49s | 8.67s | 38 incumbent / 40 Nemotron calls |
| Backtest configuration | 3.23s | 9.03s | 22 attempts per model |
No matching rows. Clear the filter to see all records.
The strategy row uses generation-only provider metrics. The other rows use the benchmark harness’s generation timer.
Executor latency increased modestly: the median was 14.1 seconds for Muse and 15.7 for Nemotron. Planning increased from 15.2 to 33.4 seconds. Configuration increased from 3.2 to 9.0 seconds.
For strategy creation, the available generation-only records put Nemotron at an 8.7-second median across all 40 calls. Historical timing records could be uniquely matched to 38 of the incumbent’s 40 generation receipts; that subset’s median was 8.5 seconds. The partial comparison suggests similar generation speed.
The portfolio harness also reports a roughly 38-second median for both models, but that clock includes grading. Separating those two calls prevents a slow grader from being mistaken for a slow strategy model.
The grader also needed an audit
One strategy request specified software or energy stocks. Nemotron used the supported INCLUDE_ONLY industry filter shown below. The language-model grader gave the draft full credit, but a deterministic checker lowered the result to 0.4 because it searched for an older IsIndustry representation.
That 0.6 deduction on one of 40 cases subtracts 1.5 points from the suite’s mean. A second industry-filter deduction is also questionable and affected both Nemotron and the incumbent. The reported 90.3 score preserves the normal grades unchanged.
The portfolio evaluator also asks for a detailed audit while its strict response format allows only a score and explanation. These findings make the strategy score less conclusive about exact rule behavior. They are a reason to inspect the generated rules alongside the grade.
{
  "stockEligibility": {
    "industryFilter": {
      "mode": "INCLUDE_ONLY",
      "match": "ANY",
      "industries": [
        "software",
        "energy"
      ]
    }
  }
}
How the full evaluation was scored
Open the method, historical baselines and limits
The executor corpus contained 69 decisions from 12 saved runs, with three Nemotron responses per decision. Its 203 usable responses each received three independent Muse Spark 1.3 Contributor grades, averaged. The four malformed responses received zero. The 207 attempts all remain in the results.
The planner used all 29 cases. Its 28 answers received three Muse grades each, aggregated by median; the timeout received zero. Strategy creation used all 40 requests, with SDK validation and one normal Muse grade for each of the 39 usable drafts. Configuration used all 22 deterministic cases. This produced 732 model-grader calls, with no incumbent candidate reruns.
Executor conversation prefixes were freshly captured against the current production context. The 69 decision identities and their original labels were retained. Twenty-five historical example answers named retired tools, so the normal scorer withheld those examples and evaluated the plan, conversation prefix and proposed action. One retired-tool check was removed and recorded.
The executor baseline is Muse Spark 1.3 Contributor from September 28. Planning uses GPT 5.6 Luna from the October 7 campaign. Strategy uses GPT 5.6 Luna from that campaign’s October 8 UTC output. Configuration uses GPT 6 Luna from September 22. All corresponding case IDs match; all 40 strategy user-message payloads also match exactly.
Muse is both the benchmark judge and the executor incumbent, which can favor that comparison. The strategy incumbent used the normal repair pipeline; Nemotron used first-response validation with incumbent repairs disabled. These differences prevent a controlled claim that the model alone caused every gap.
This was an evaluation of assistant decisions and authored rules. Configuration outputs were checked without launching actual backtests. The results measure these saved workloads and grading rules.
Inspect the conditions before testing the returns
A useful next step is to make the assistant expose a strategy’s entry and exit conditions. Inspect one condition that should pass and one that should fail. This makes an incorrect AND/OR relationship or a missing exit easier to spot than a polished explanation.
Open Aurora and review the following request before sending it. The expected output is a plain-English rule check with two worked observations.
Inspect the recorded comparison
The downloadable table contains the eight model/task rows used in these figures, including dates, sample counts, grade units, generation cost and median latency. It preserves the partial strategy-timing sample rather than filling the two missing incumbent matches.
No comments yet.